Efficio is one of the leading software solutions for energy management and even the basic version covers all the requirements for a professional energy management system. For even higher demands, a number of functions and modules are available in Efficio, which significantly support the certification process according to ISO 50001, DIN 16247-1 or EMAS and ensure customer-specific energy reporting.
Because every business unit has different needs when it comes to energy management, you can choose different functions and modules in Efficio. Energy officers must ensure sustainable energy optimization and increased energy efficiency through energy performance indicators (EnPI), controlling must determine exact energy costs and distribute energy consumption data to cost centers, while production and maintenance must monitor key production indicators and identify anomalies such as: B. Detecting leaks and leveraging savings potential. Our powerful modules are available to you in Efficio for all of these requirements. Efficio meets the requirements of ISO 50001:2018 and is approved by BAFA as an energy management system eligible for funding.
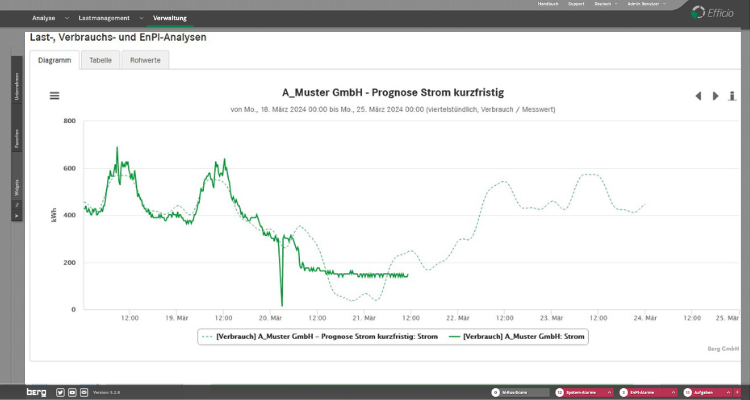
NEW: AI forecast module
- Consumption forecast for real and virtual measuring points
- Assistance with budget planning for the following year
- Support for energy purchasing with short or medium-term forecasts
- Early identification of necessary measures to achieve energy-saving targets
- Separate software module – requires no operation or maintenance
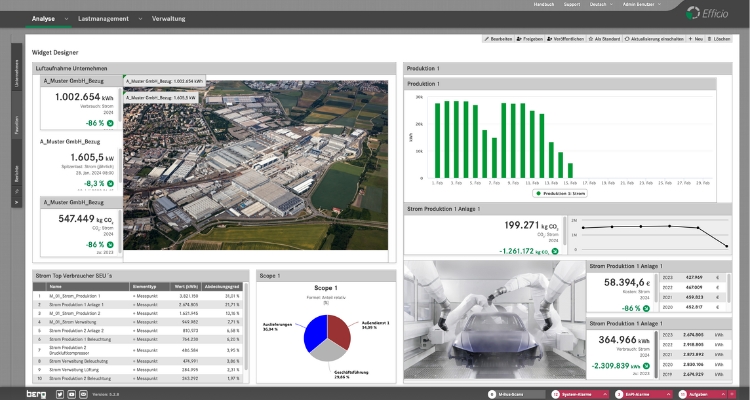
Modul Widget – Designer
- Visual preparation of live information
- Own design of individual analysis widgets, e.g. for production units, properties or flow charts
- Display of current values of meters, sensors, costs, CO2 emissions
- Display of value widgets with alarms, trends and histories
- Realization of overviews of detailed areas through links
- Insert explanatory free texts quickly and easily with the WYSIWYG editor and arrows
- Use the widget designs for other applications such as dashboards and power reports
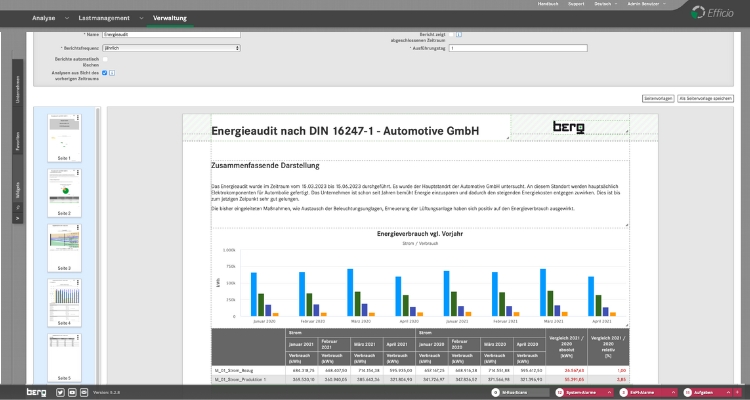
Power reports module
- Create individual energy reports using drag & drop with the powerful report generator
- Automatically update report content
- Page templates, headers and footers, placeholder texts offer simple layouts adapted to the company’s CI
- Insert background images for letter templates or CI design
- Freely position, scale and overlay analyses, texts and images
- Create page templates for recurring design features and standardized reports
- Save time when creating the management review
- Unlimited number of pages and widgets possible
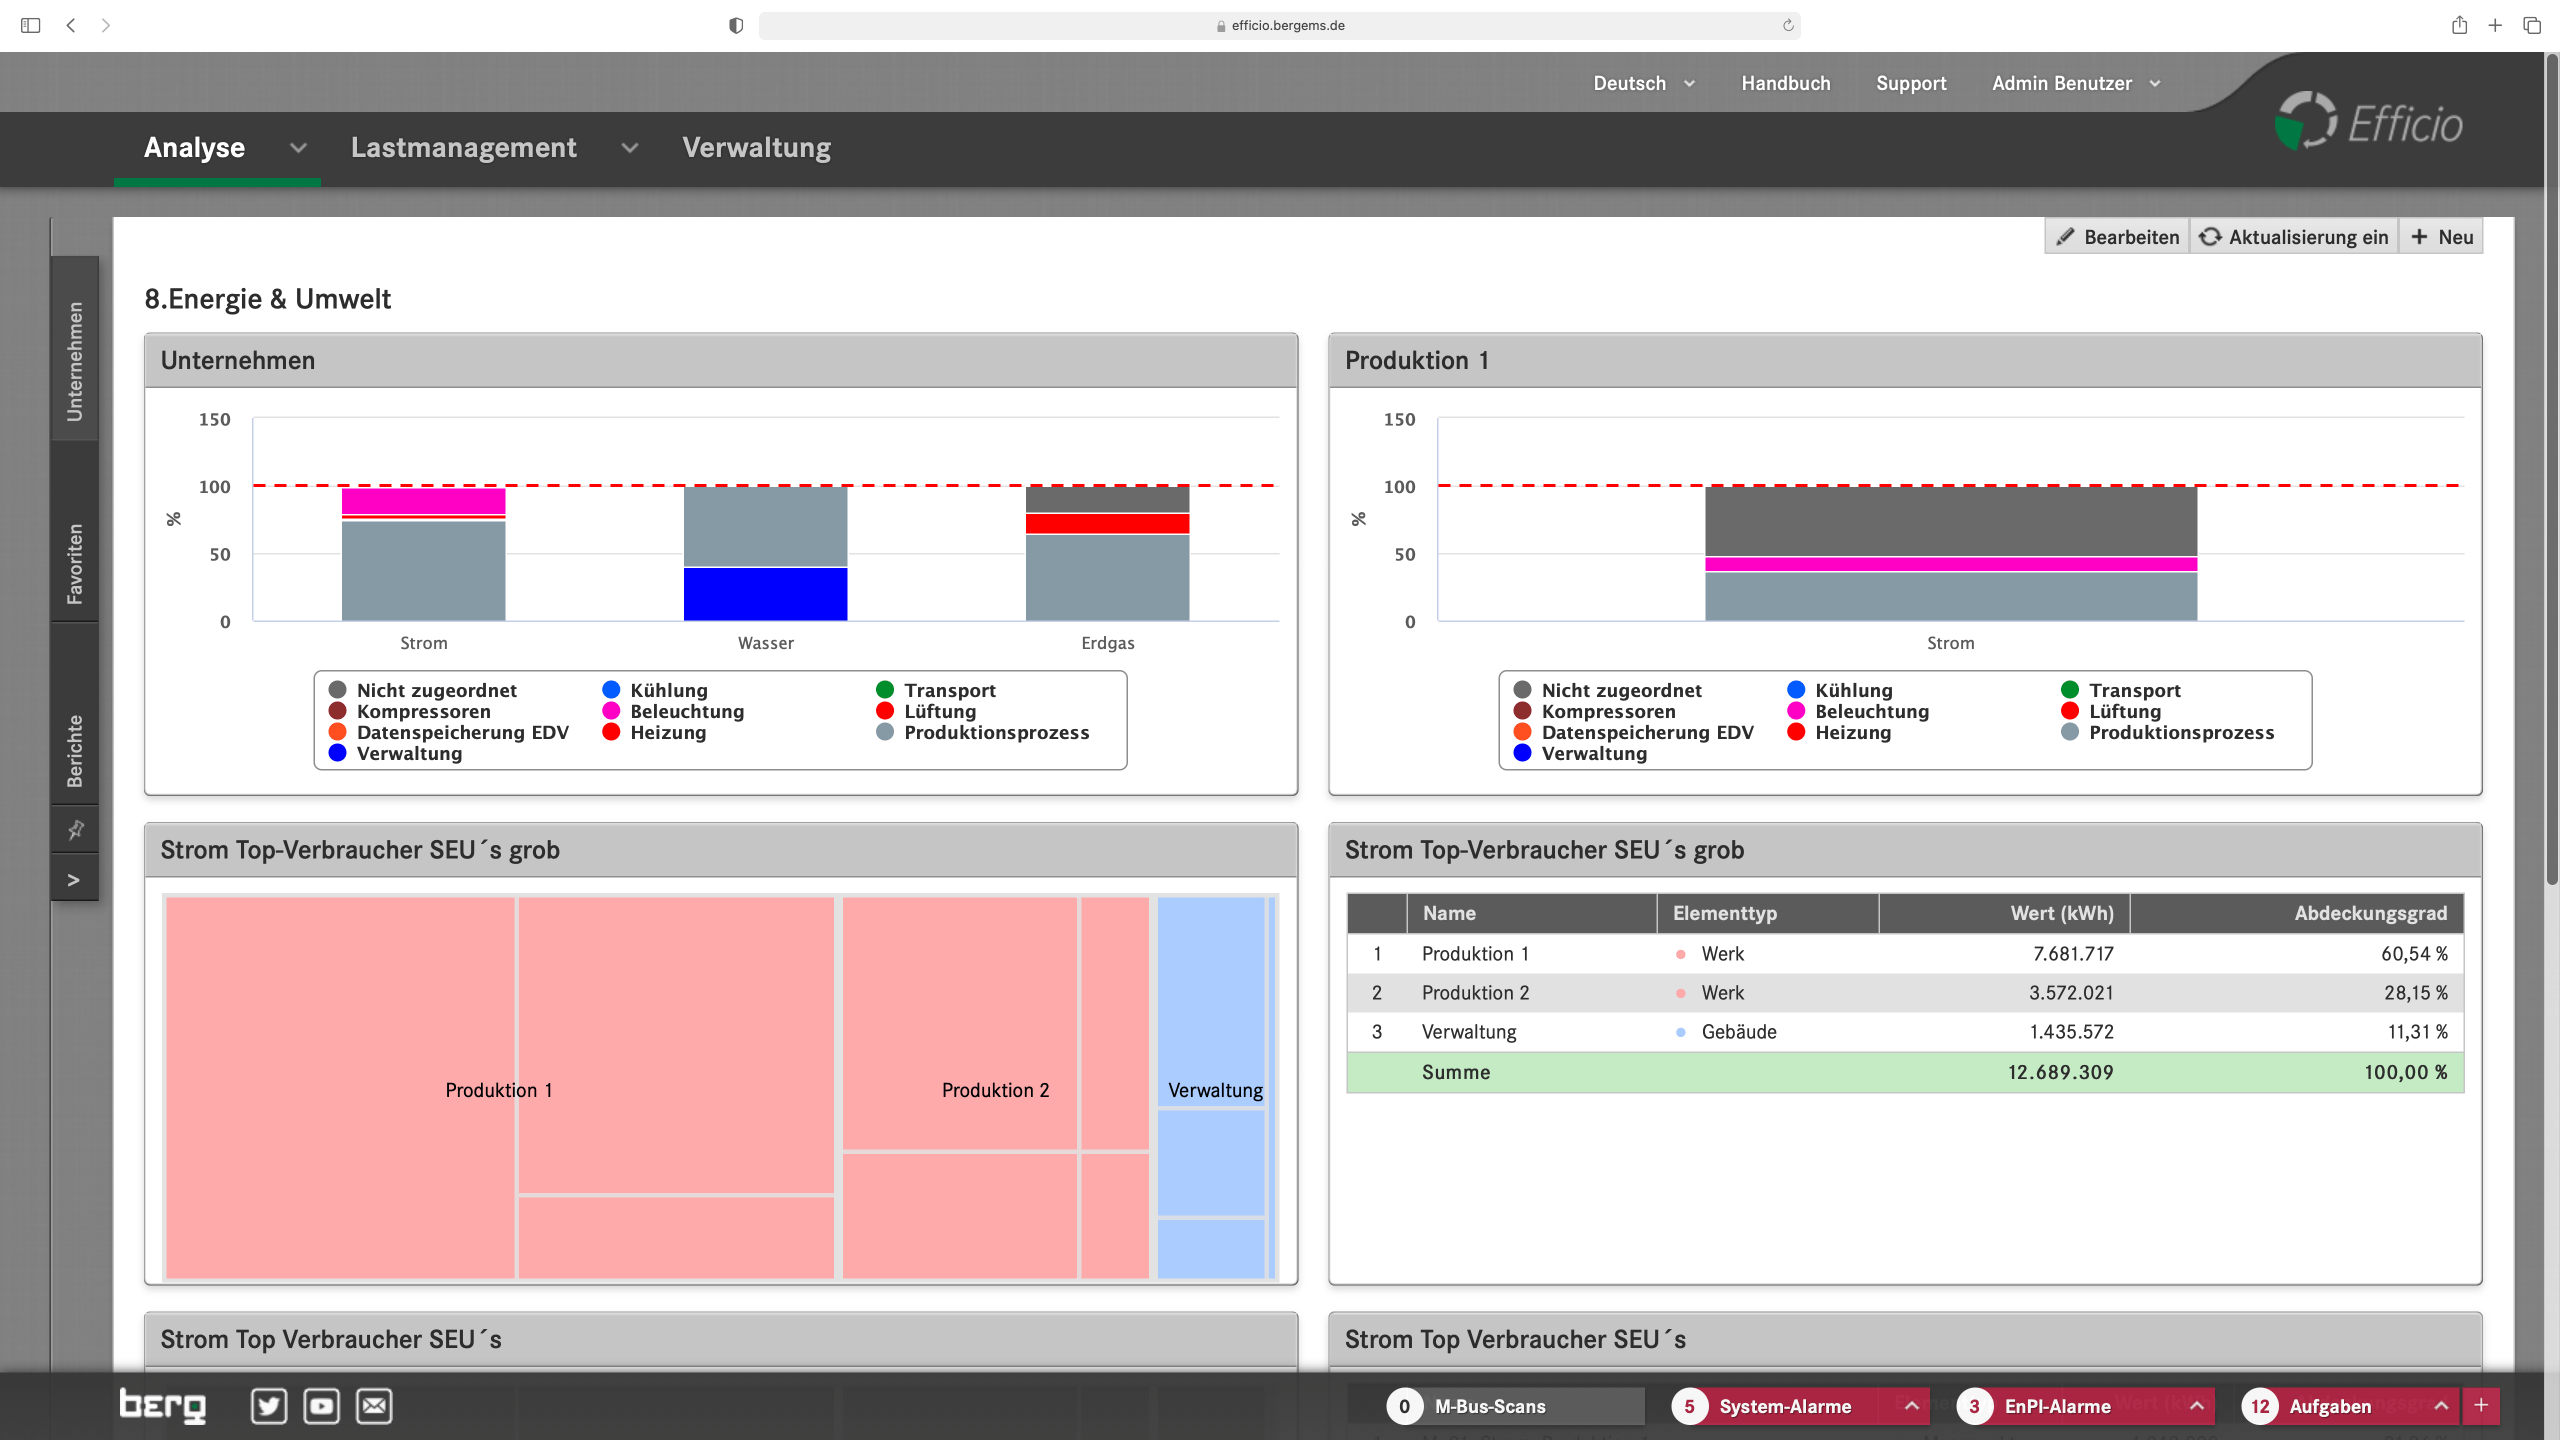
Energy & Environment module
- (Re-)certification at the touch of a button
- Set and achieve strategic, organizational and operational energy goals
- Present, implement and evaluate measures
- Calculate profitability using ROI, break-even point and amortization
- Simplify team collaboration
- Mapping and implementation of the PDCA process
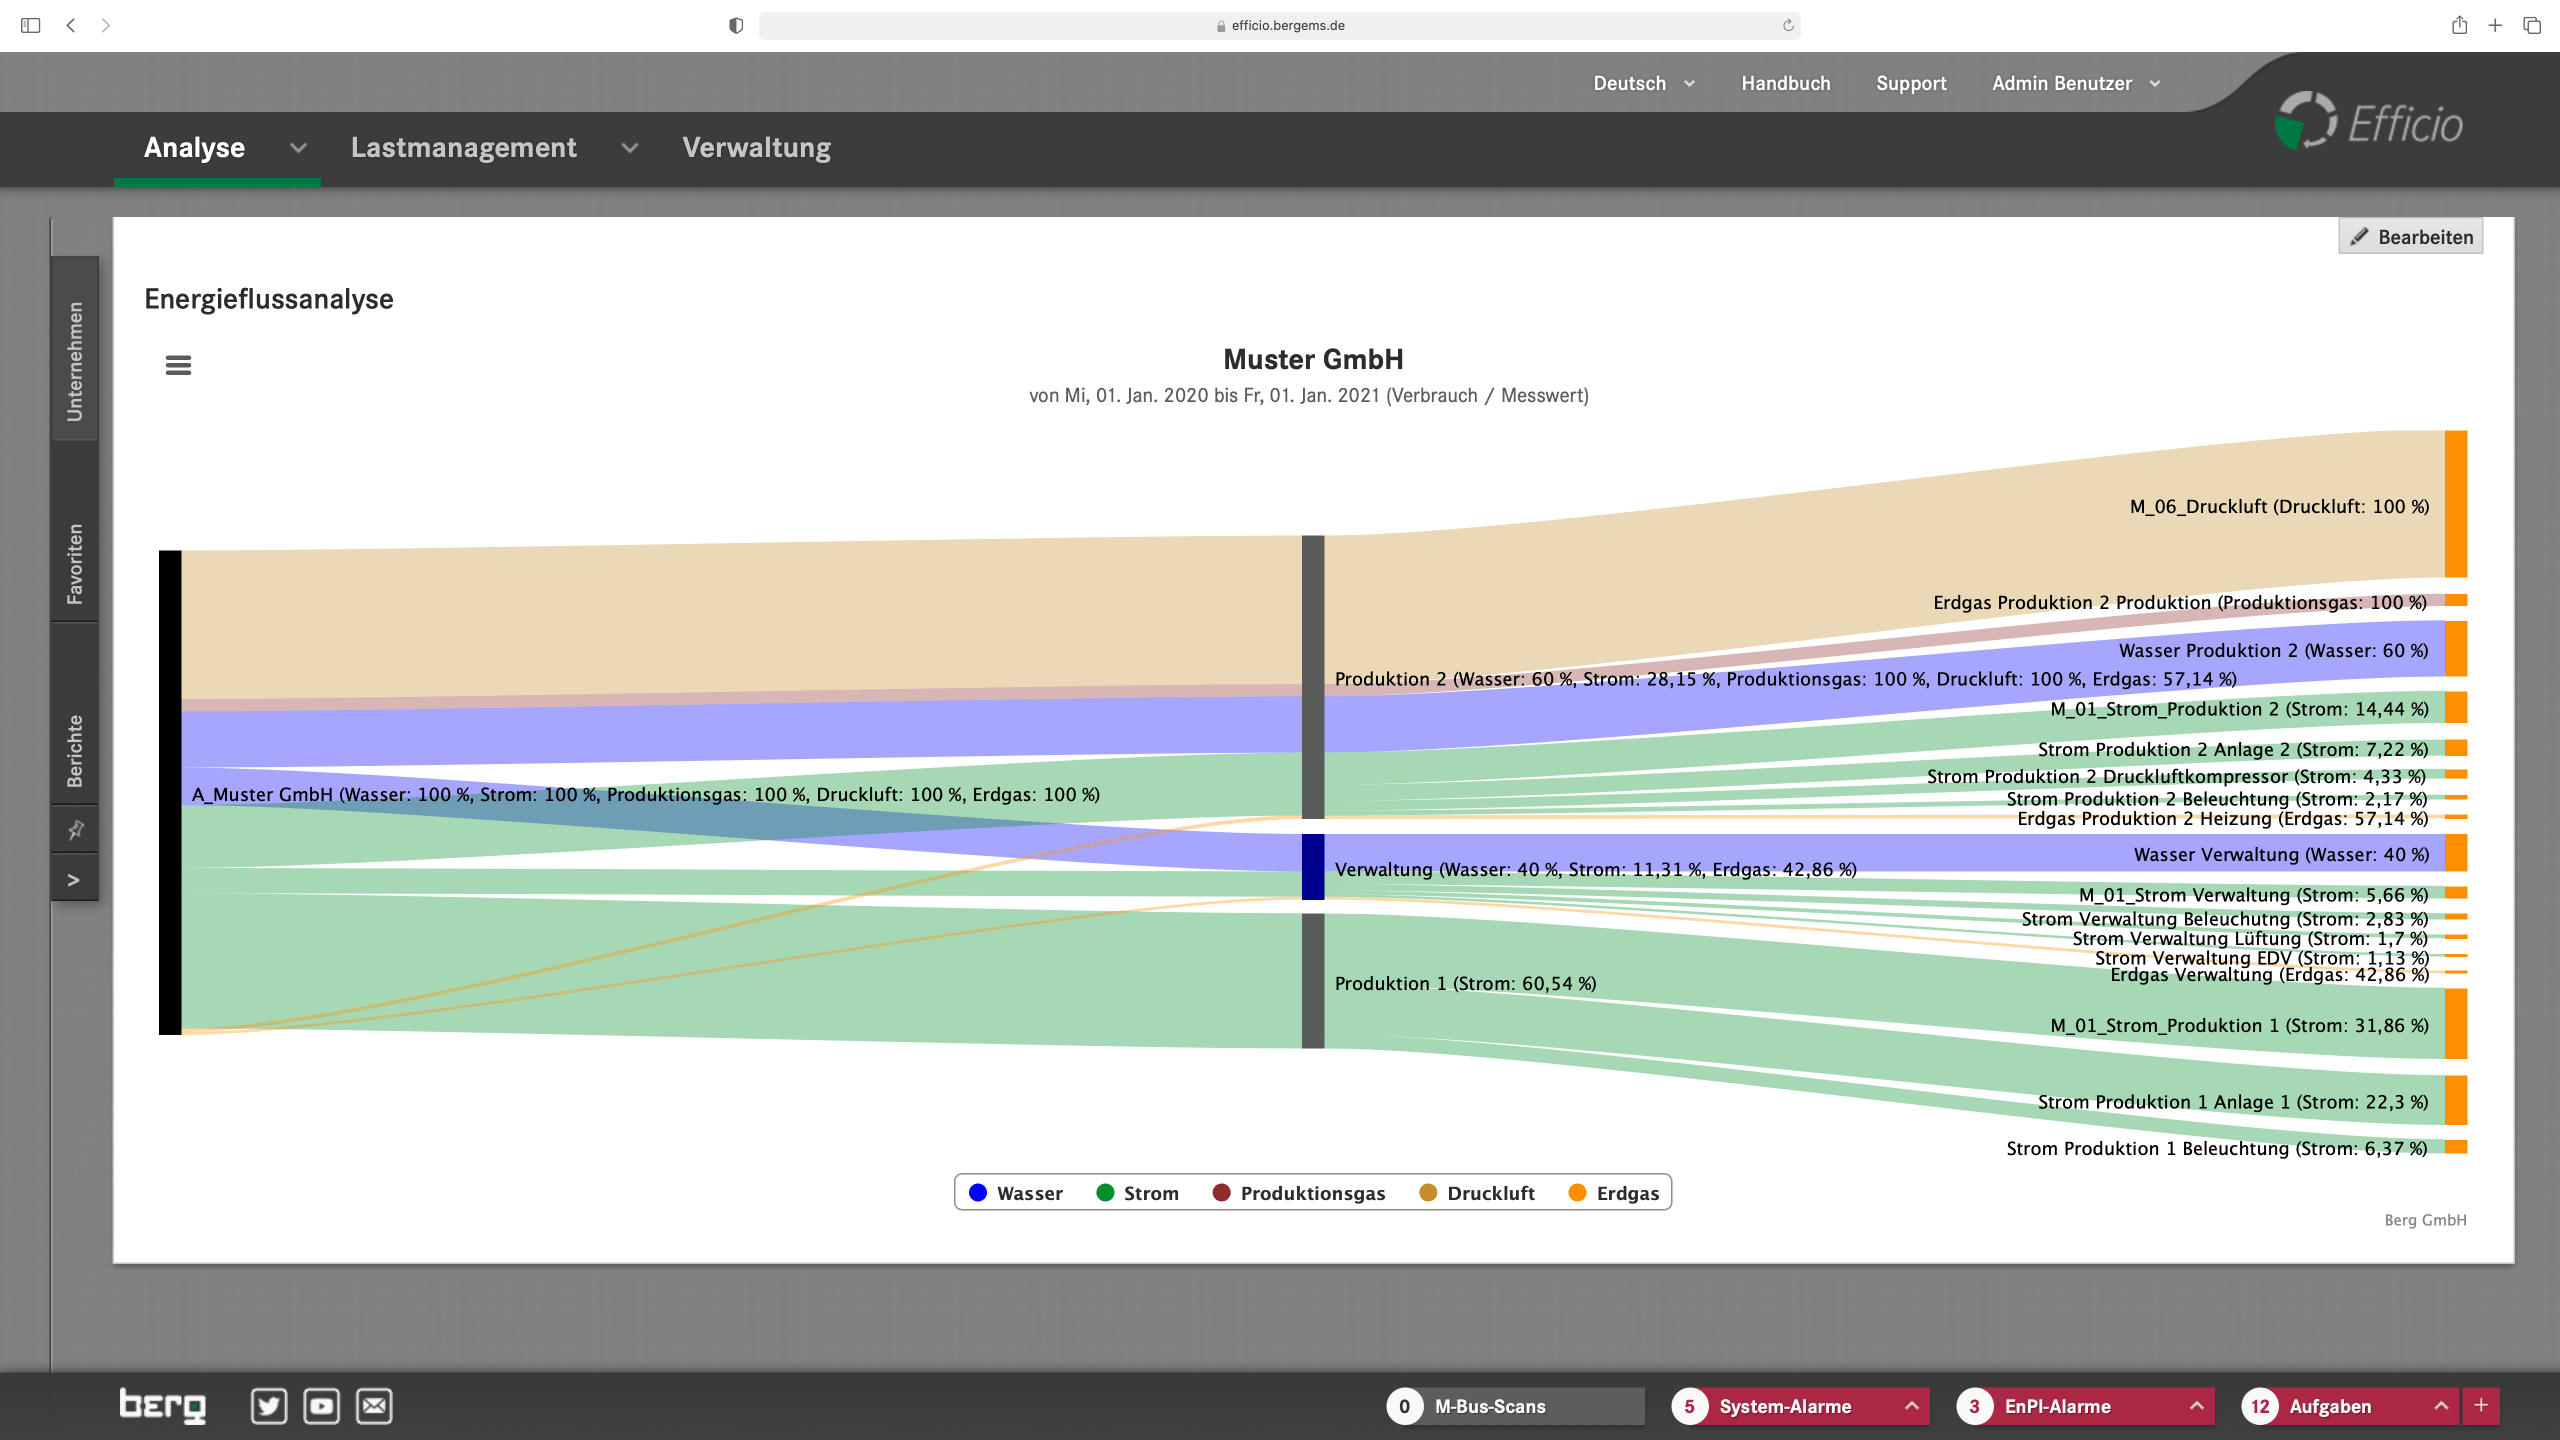
Sankey diagrams
- Visualize energy flows in the form of consumption quantities, costs or CO2 quantities from feed-in/generation to the last consumer
- See at a glance how much energy, water or other auxiliary materials are required by which production systems
- Automatically map energy flows from the individually constructed topology (hierarchy, company tree).
- Tapes in quantity-dependent thickness clearly, transparently and clearly visualize who is the main buyer or small buyer
- Identify priorities where savings measures have the greatest effect
- Important part of ISO 50001 reporting
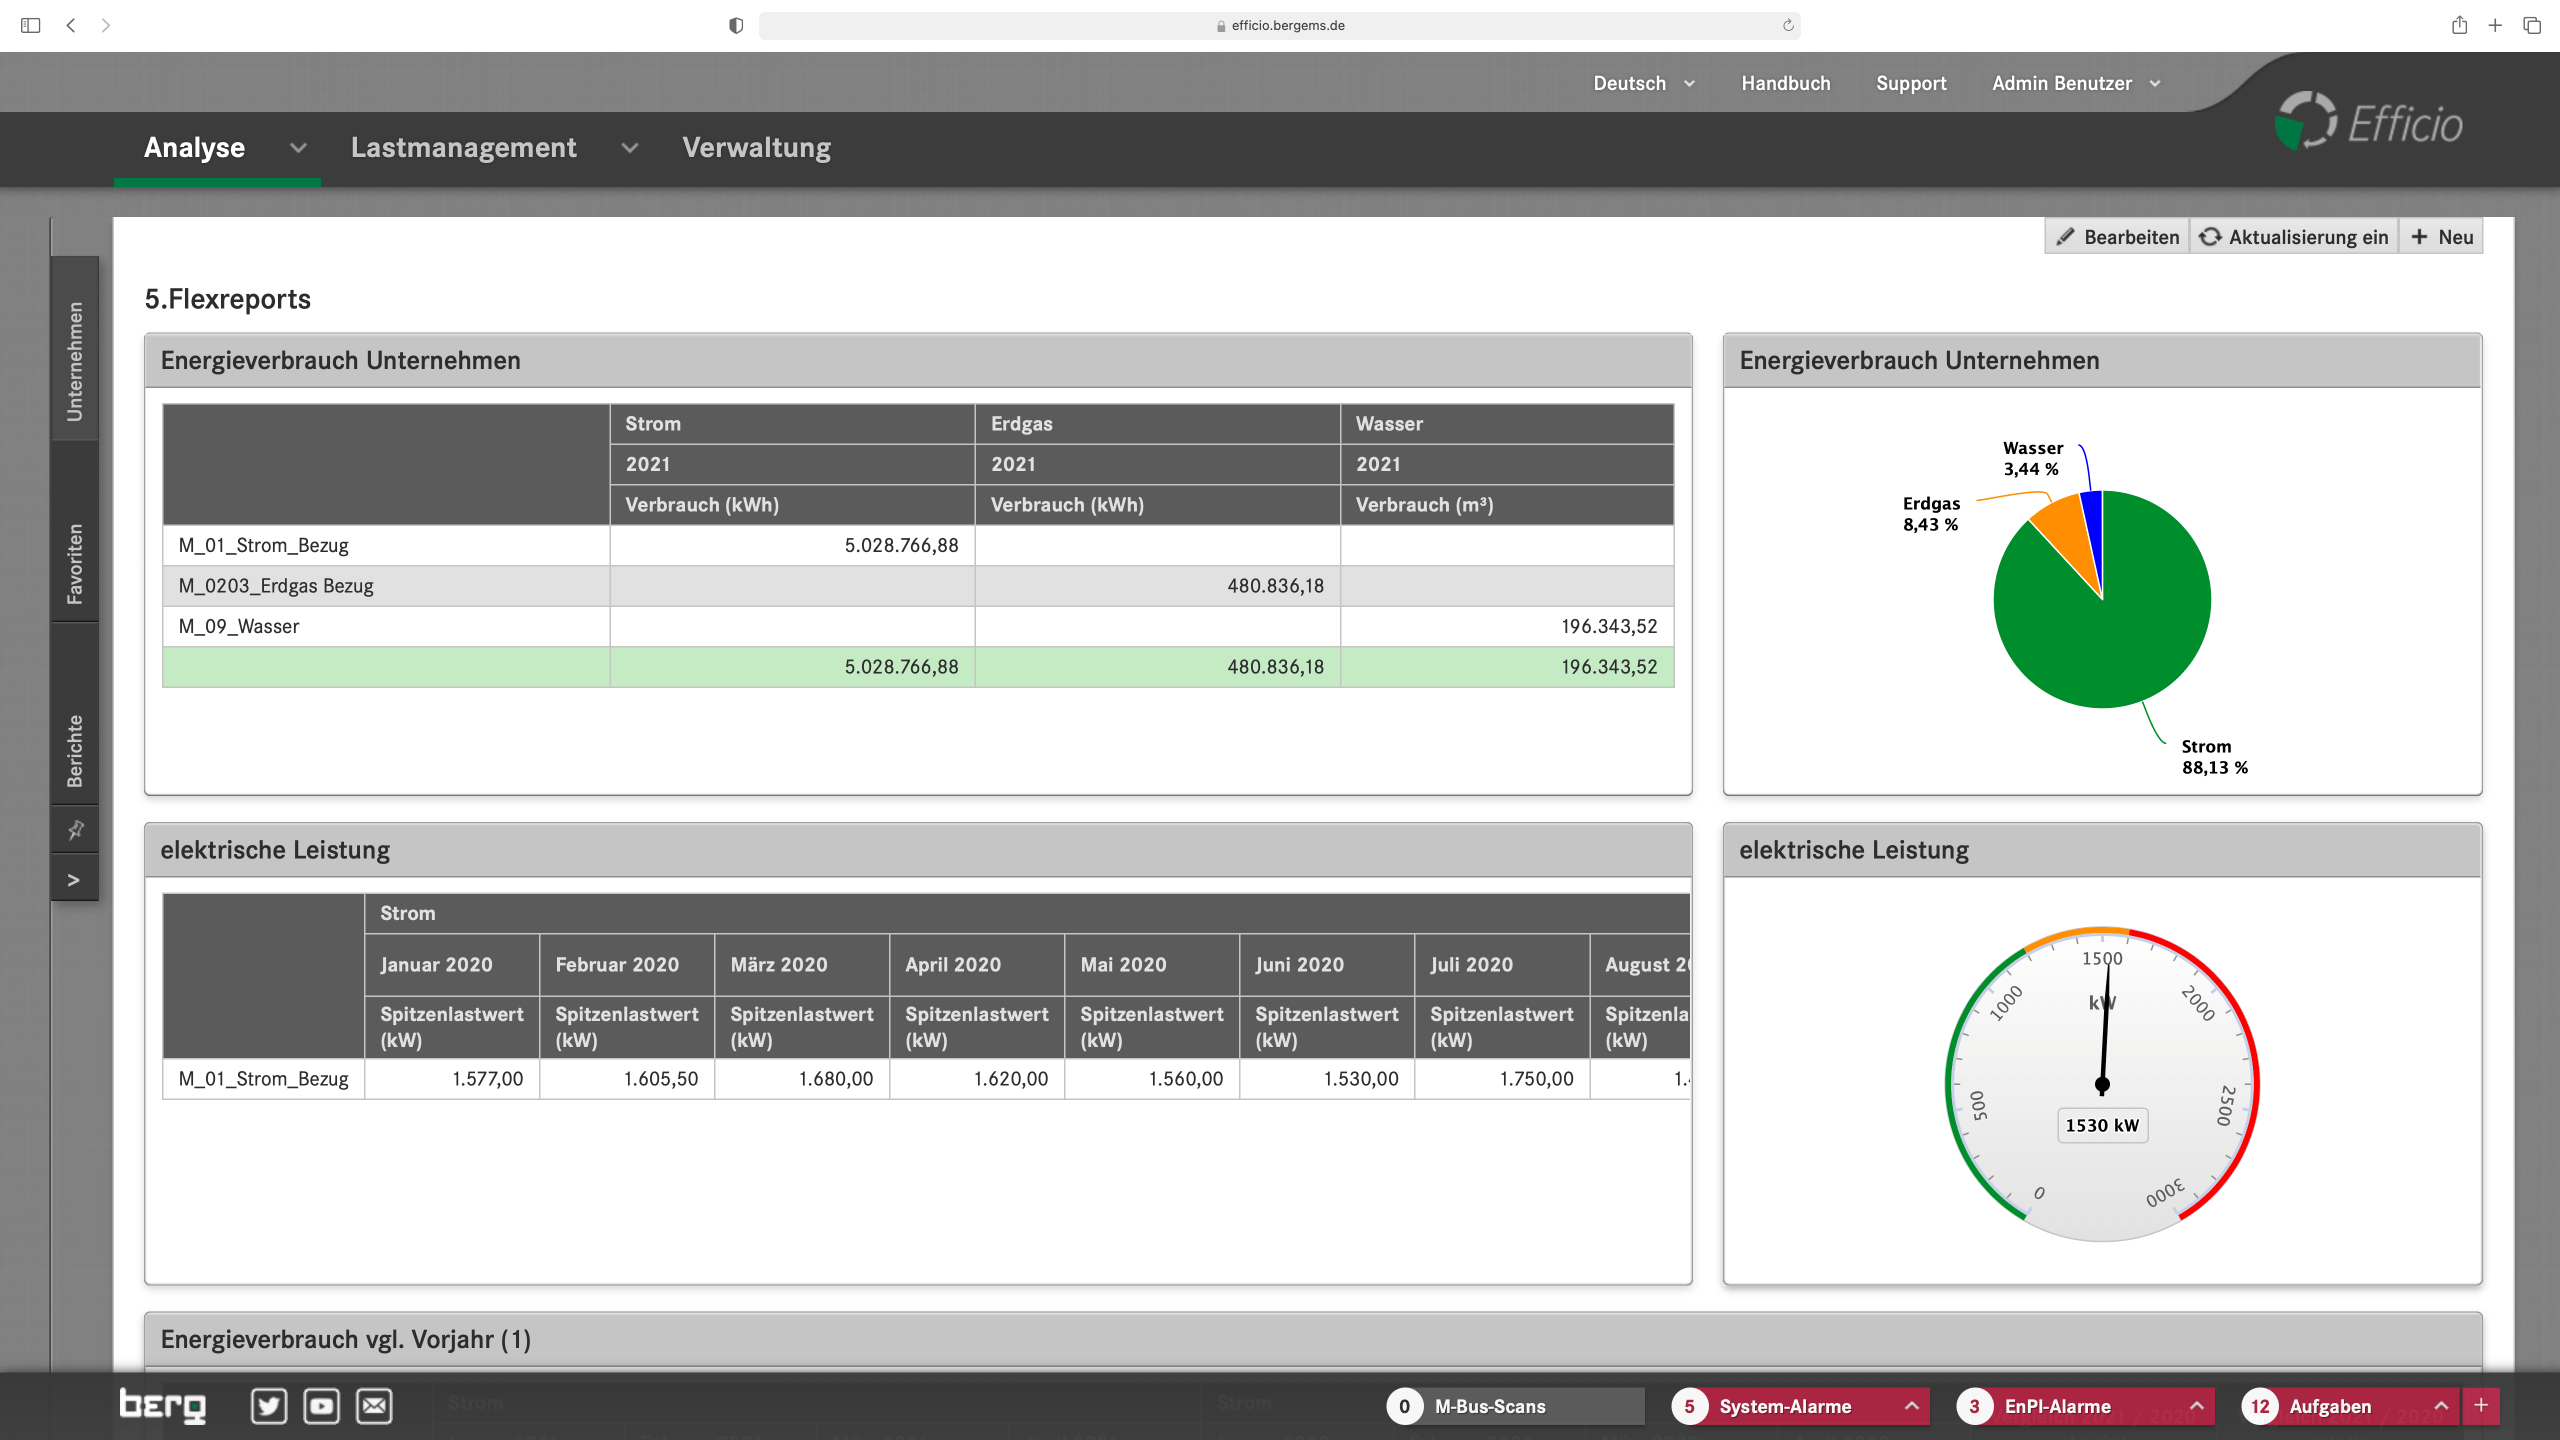
Flexreport
- Design an individual, tabular and graphical reporting system that is almost typical for Excel with a simple workflow
- Create evaluations for individual real or virtual measuring points for a company element such as a building, production facility, location or factory
- Report templates are automatically and periodically (finely adjustable) filled with current values and can be automatically distributed to various recipients
- Each Flexreport can easily be filled with data from freely selectable observation periods and can be exported to Excel if desired
- Graphically prepare data from selected rows or columns as lines, bars, pies or speedometer graphics
- Automatically import exported Flexreports into other expert systems in the company, e.g. for internal cost distribution
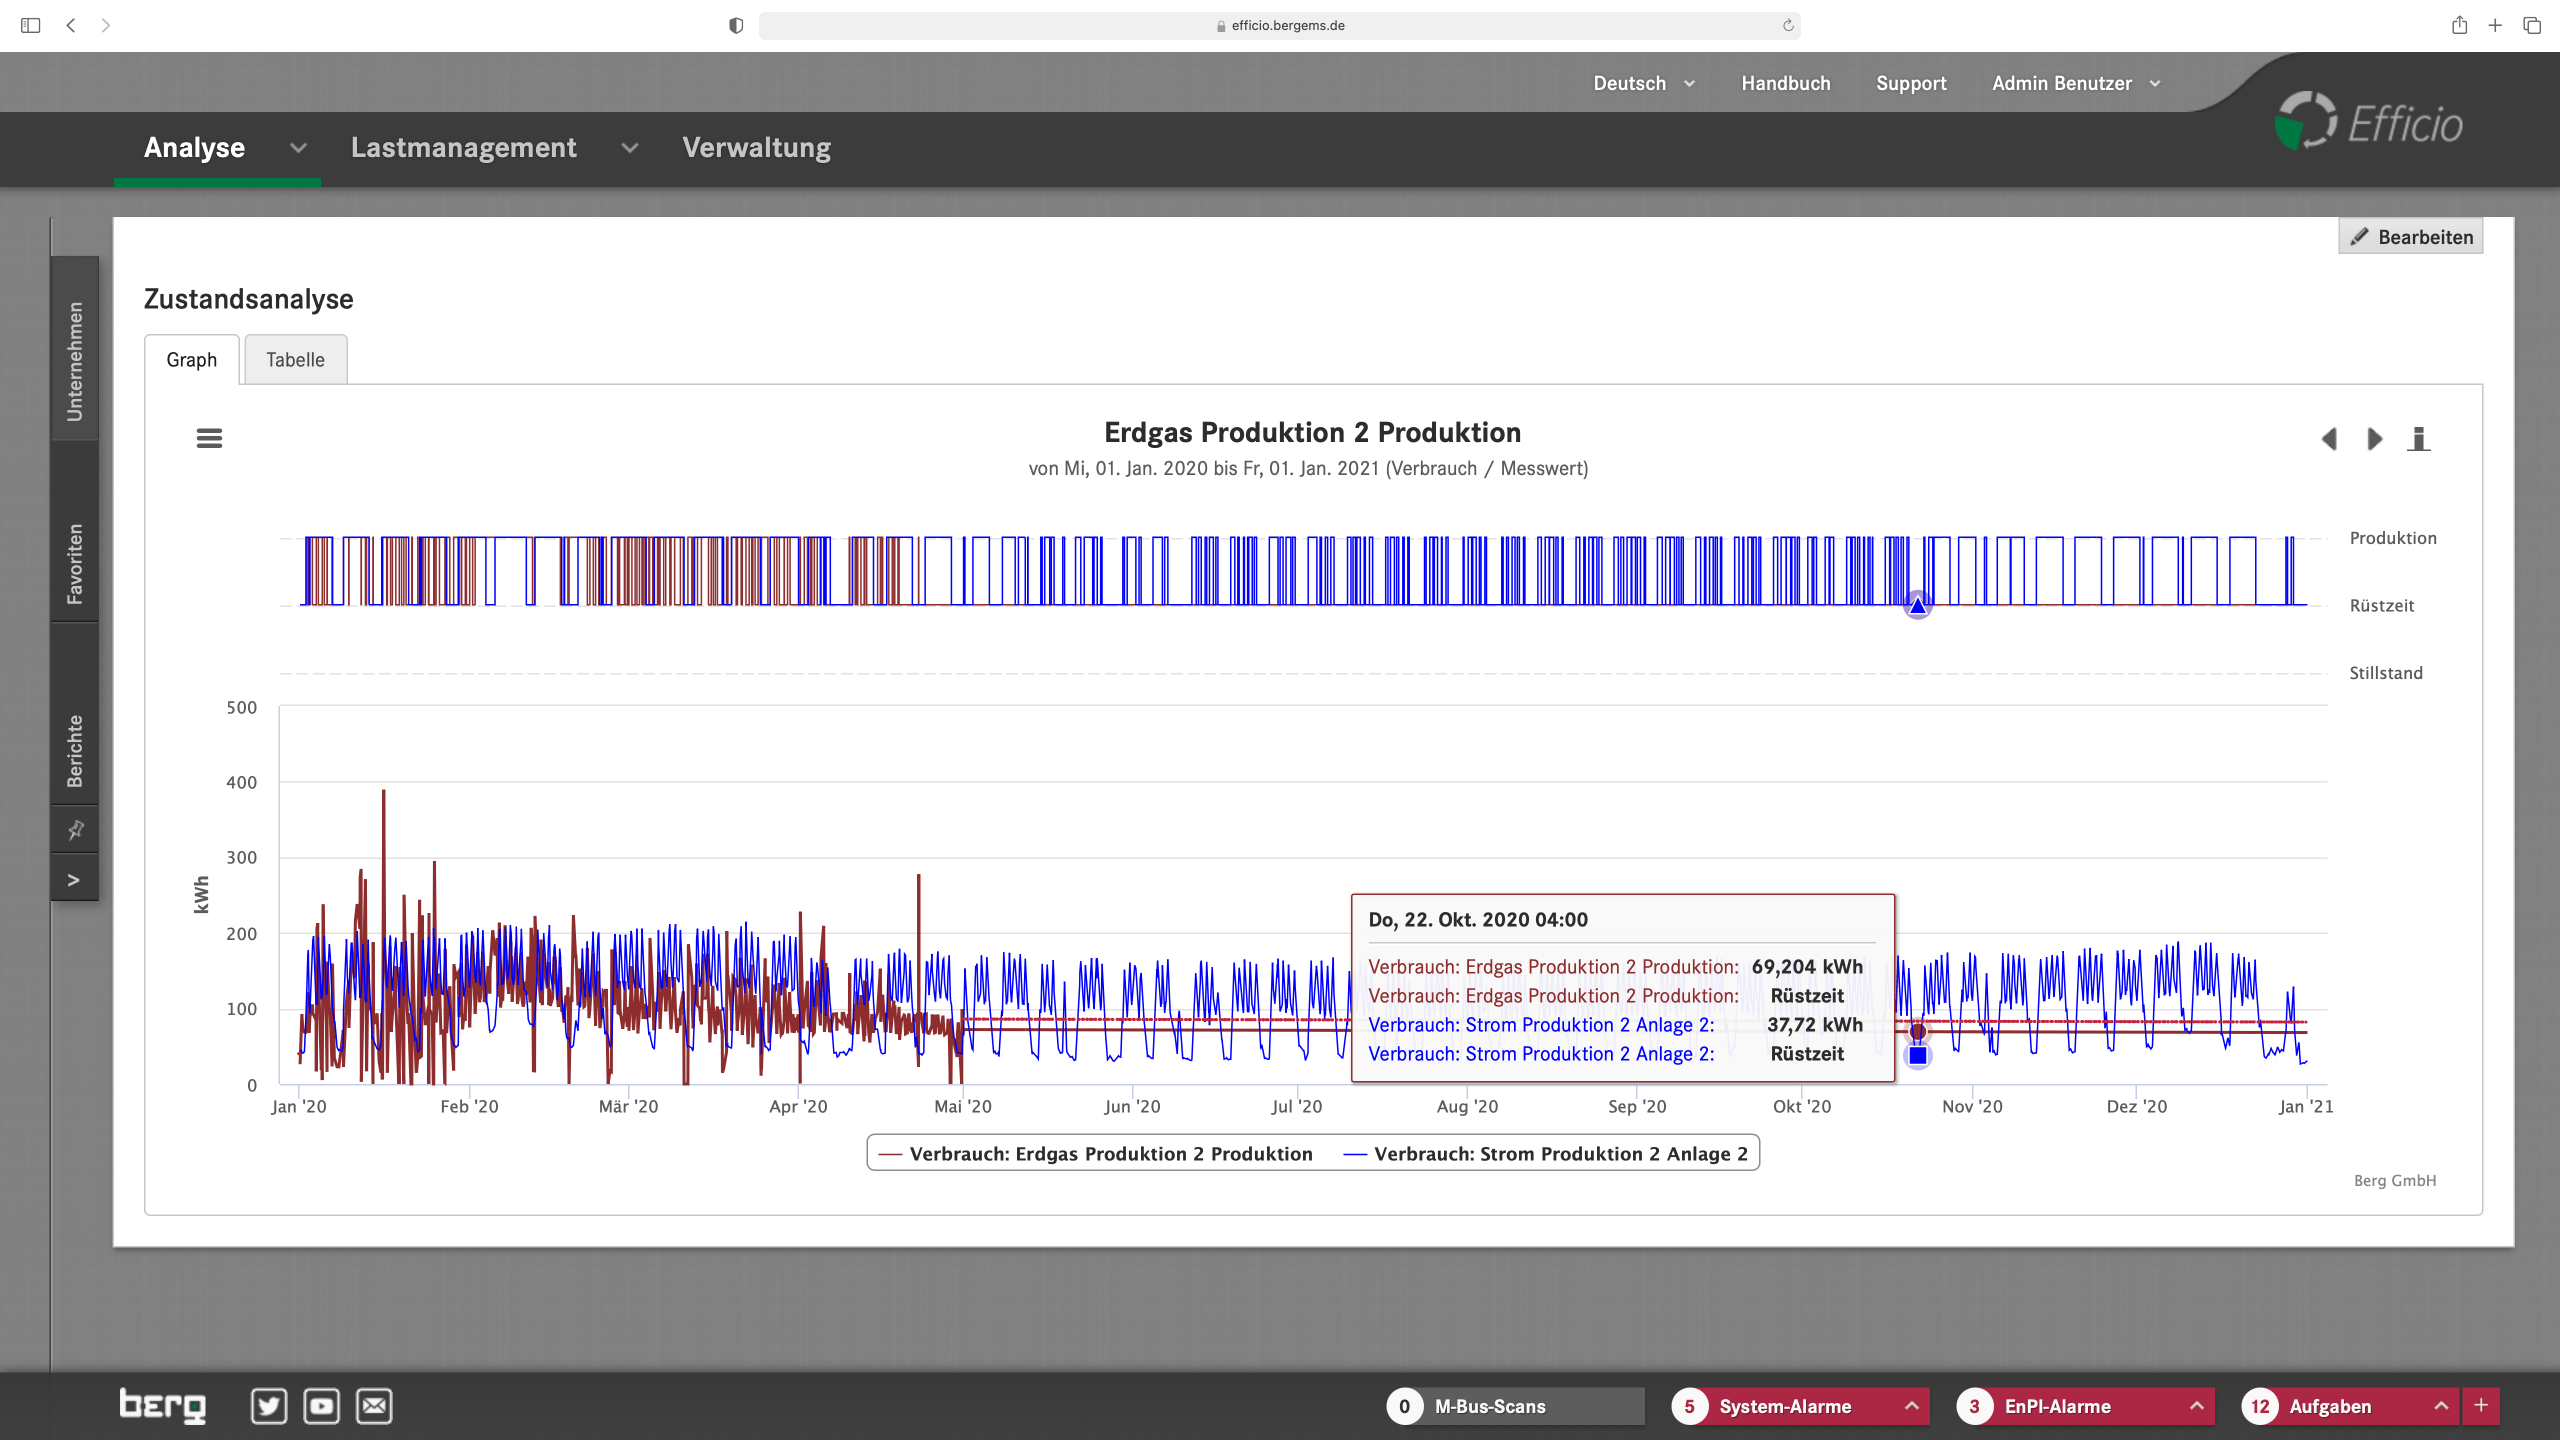
Condition analysis
- Automatically derive states and limit areas from individual measurements and evaluate them separately
- Analyze standby behavior, system states, operating states, climate zones
- Answer questions such as how long did each condition last and in what period? or How much cost did this condition cause during this period?
- Detect gradual changes and avoid failures (preventive wear detection)
- Analyze heating, ventilation and air conditioning systems and save costs through adapted behavior
- Associating production committees with specific operating states and their occurrence
- Analyze system efficiencies in different operating phases
- Easily recognize usage behavior: How long was electricity used at which charging station and during which period?
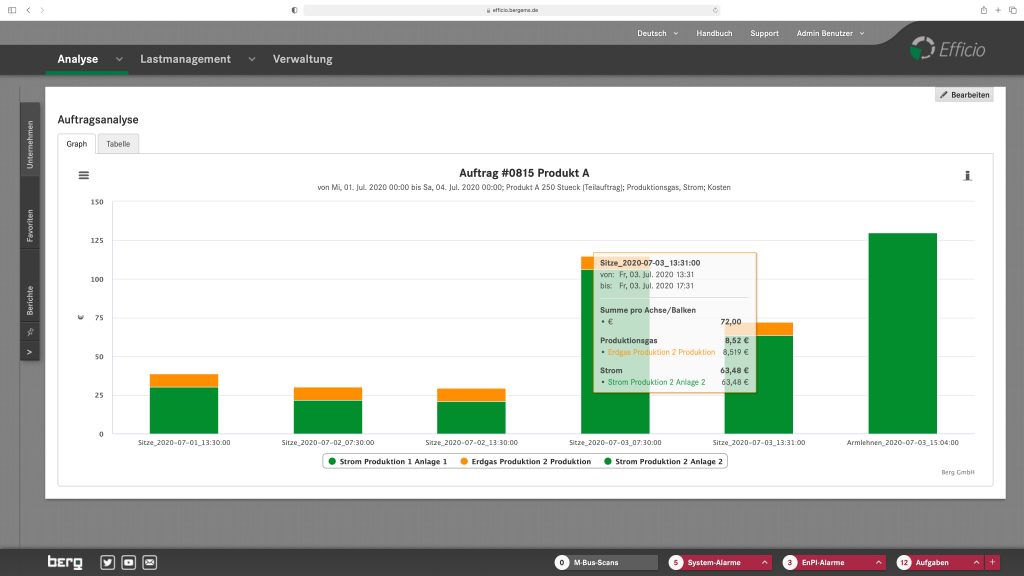
Order key figures (EnPI)
- Calculate the amount of energy or costs required to produce a product
- Combine energy quantities and production times from different systems and measurements depending on the order
- Analyze energy consumption of individual work steps and combine them into a total energy consumption for all required work steps
- Monitor order metrics and display them in dashboards
- Show relative consumption or cost quantities of individual work steps per medium in stacked bar charts
- Analyze partial orders
- Combine variable cost blocks for billing purposes, such as occupancy of charging stations, trade fair stands, ship docks, etc.
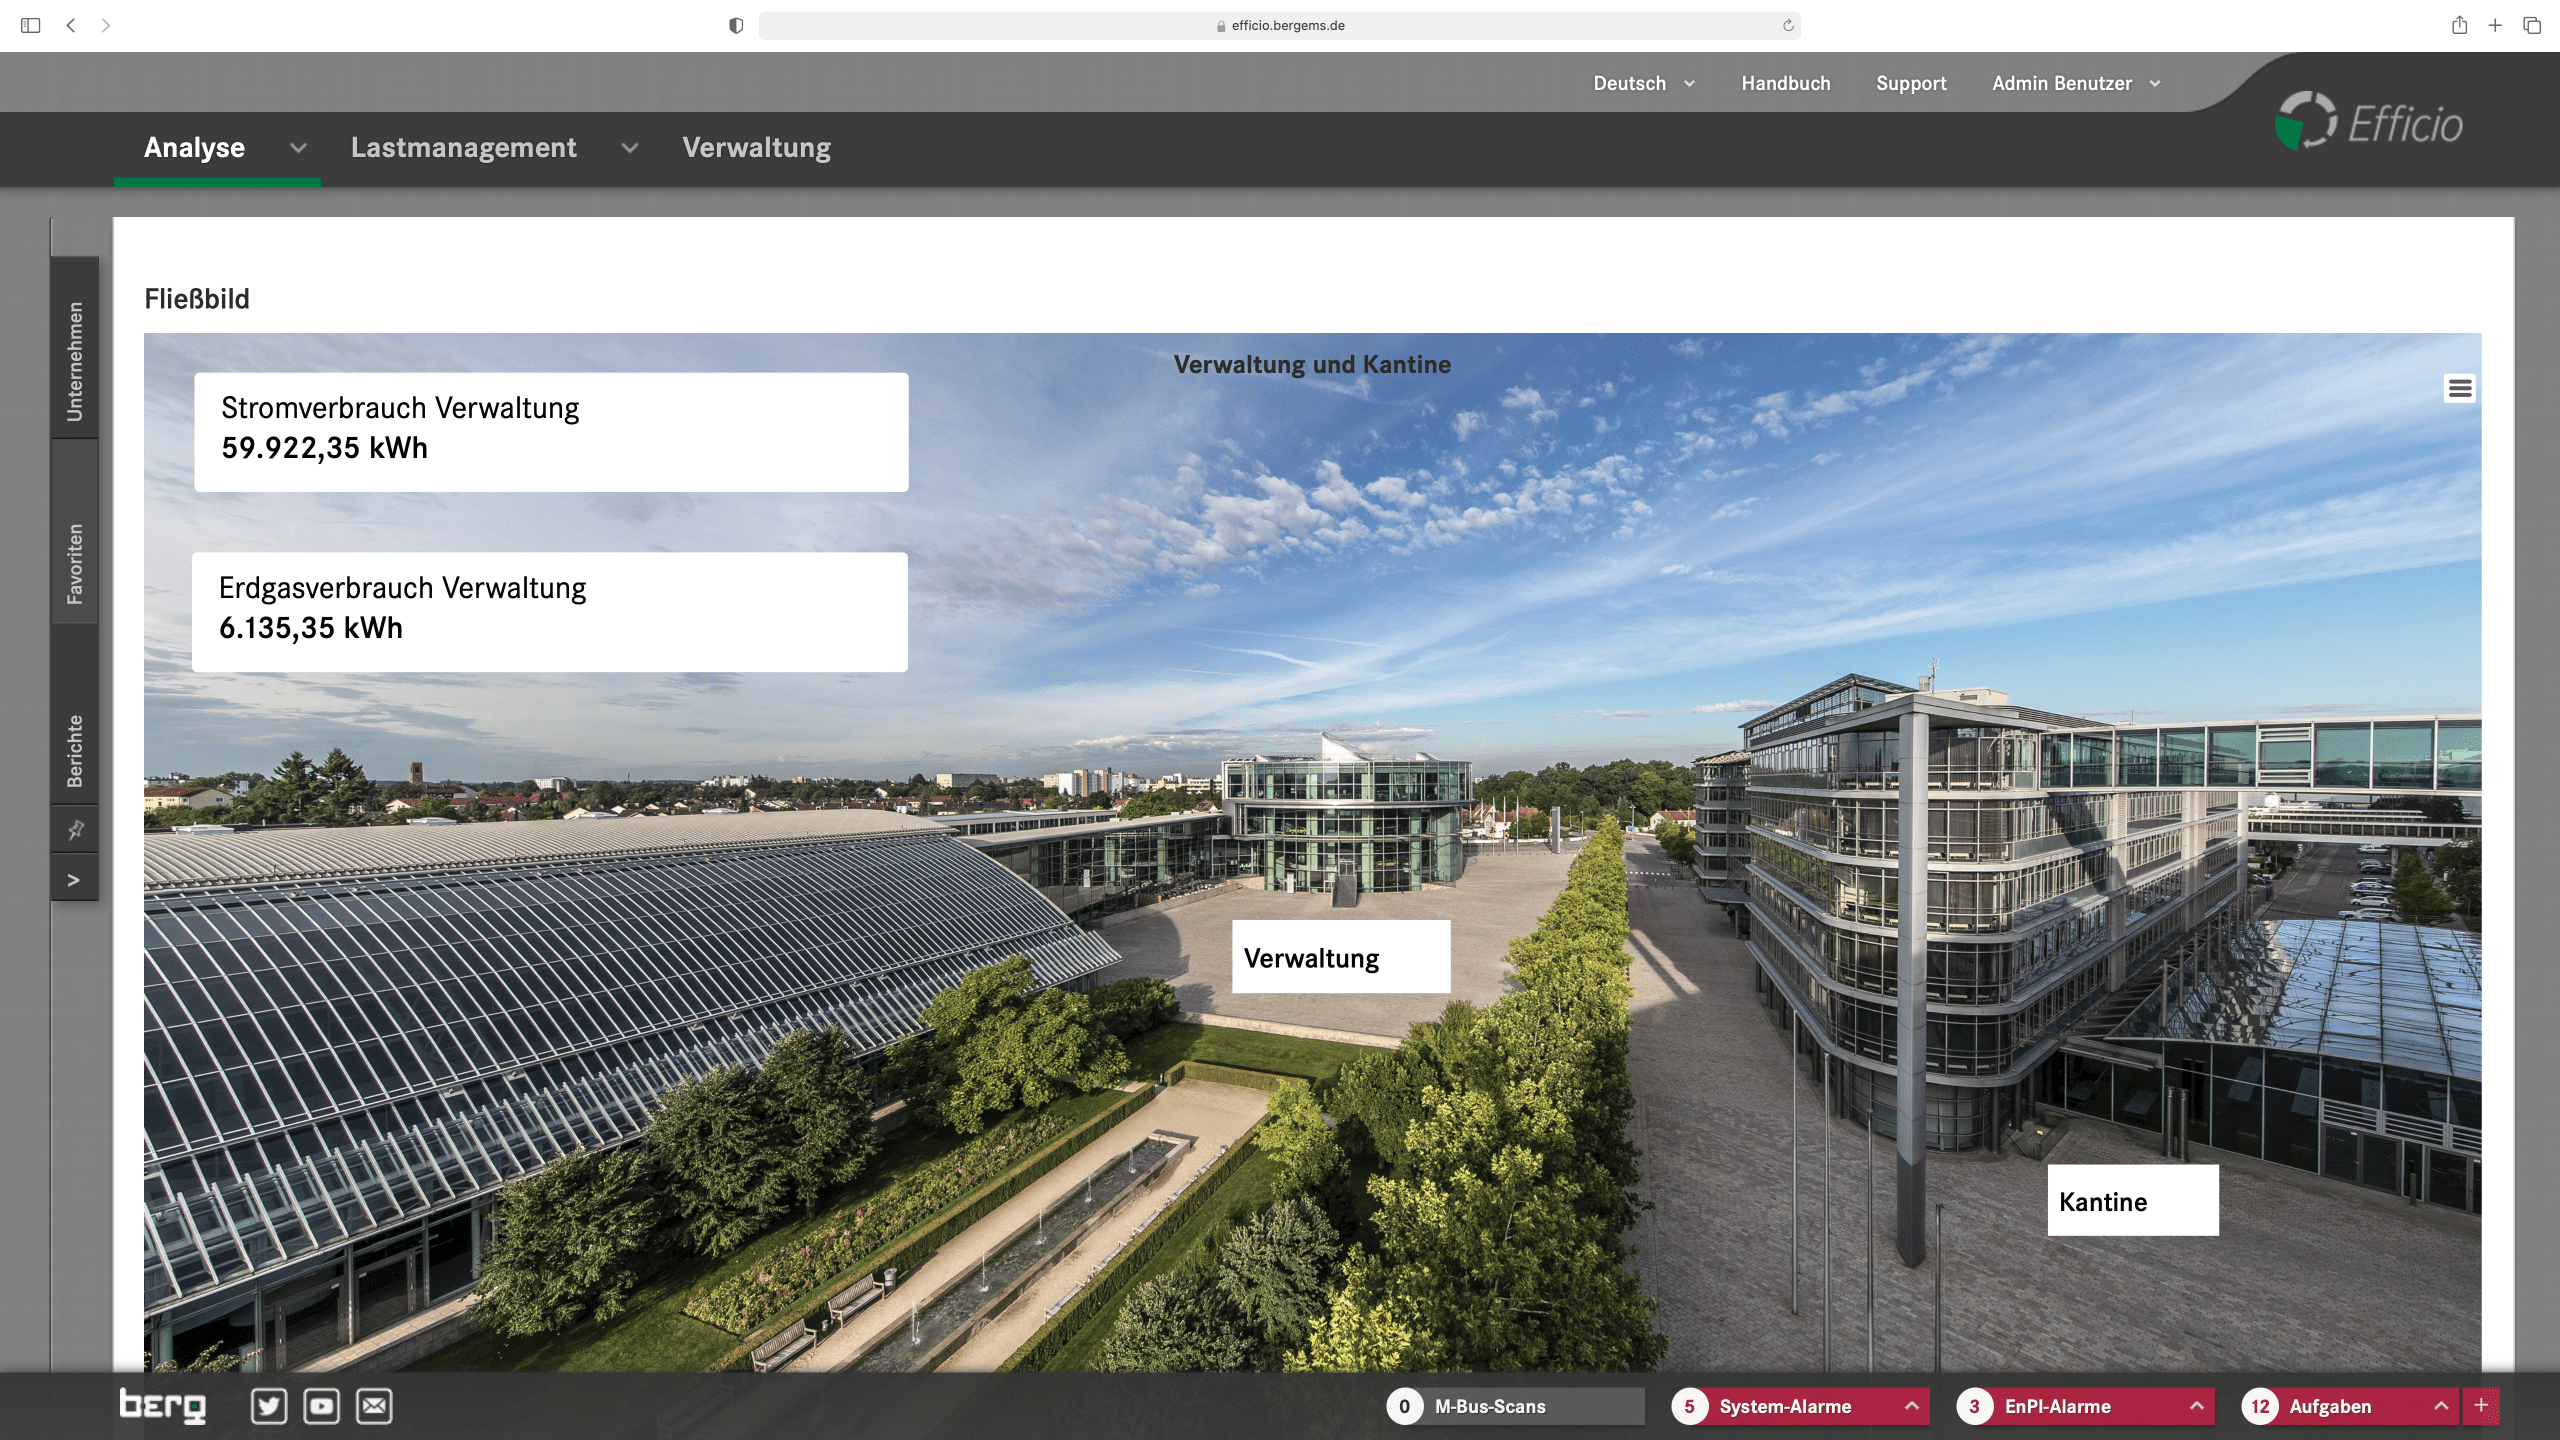
Flow charts
- Position consumption, costs, load values or CO2 emissions freely on aerial photographs, road maps, system diagrams, overview images or similar
- Use any background images to visualize position-dependent measurements
- Nest flow diagrams with each other in order to advance from an overview situation to a detailed view (“drill down” flow diagrams)
- Visualize current consumption or production quantities, e.g. monitor to display the photovoltaic system with a display of the current power and production quantity per time
- Inform employees and customers about your own energy savings
- Show flow charts on entrance or hall monitors in full screen mode
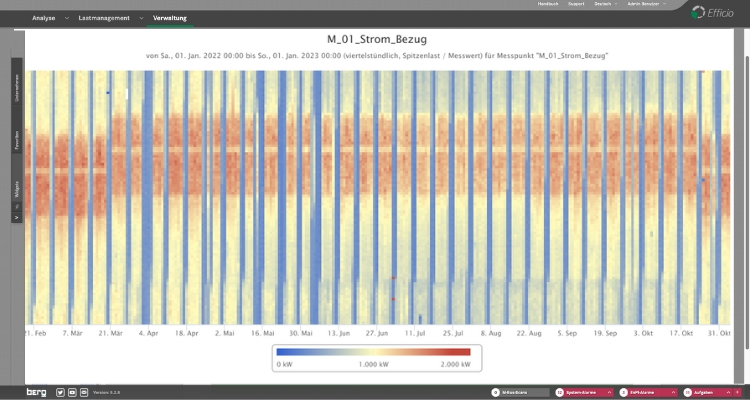
Heatmap
- Visually immediately identify conspicuous “hot spots” from a variety of measurements
- Adjust the color spectrum to the measured values to increase the informative value
- Time scrolling to compare with previous time periods
- Analyze “hot spots” in terms of their temporal association and frequency
- Detect leaks
- Recognize unusual consumption behavior during off-peak times
- Compile heatmaps (spectral analysis) into dashboards to monitor many areas very quickly
- Incorporate spectral analyzes into regular reporting
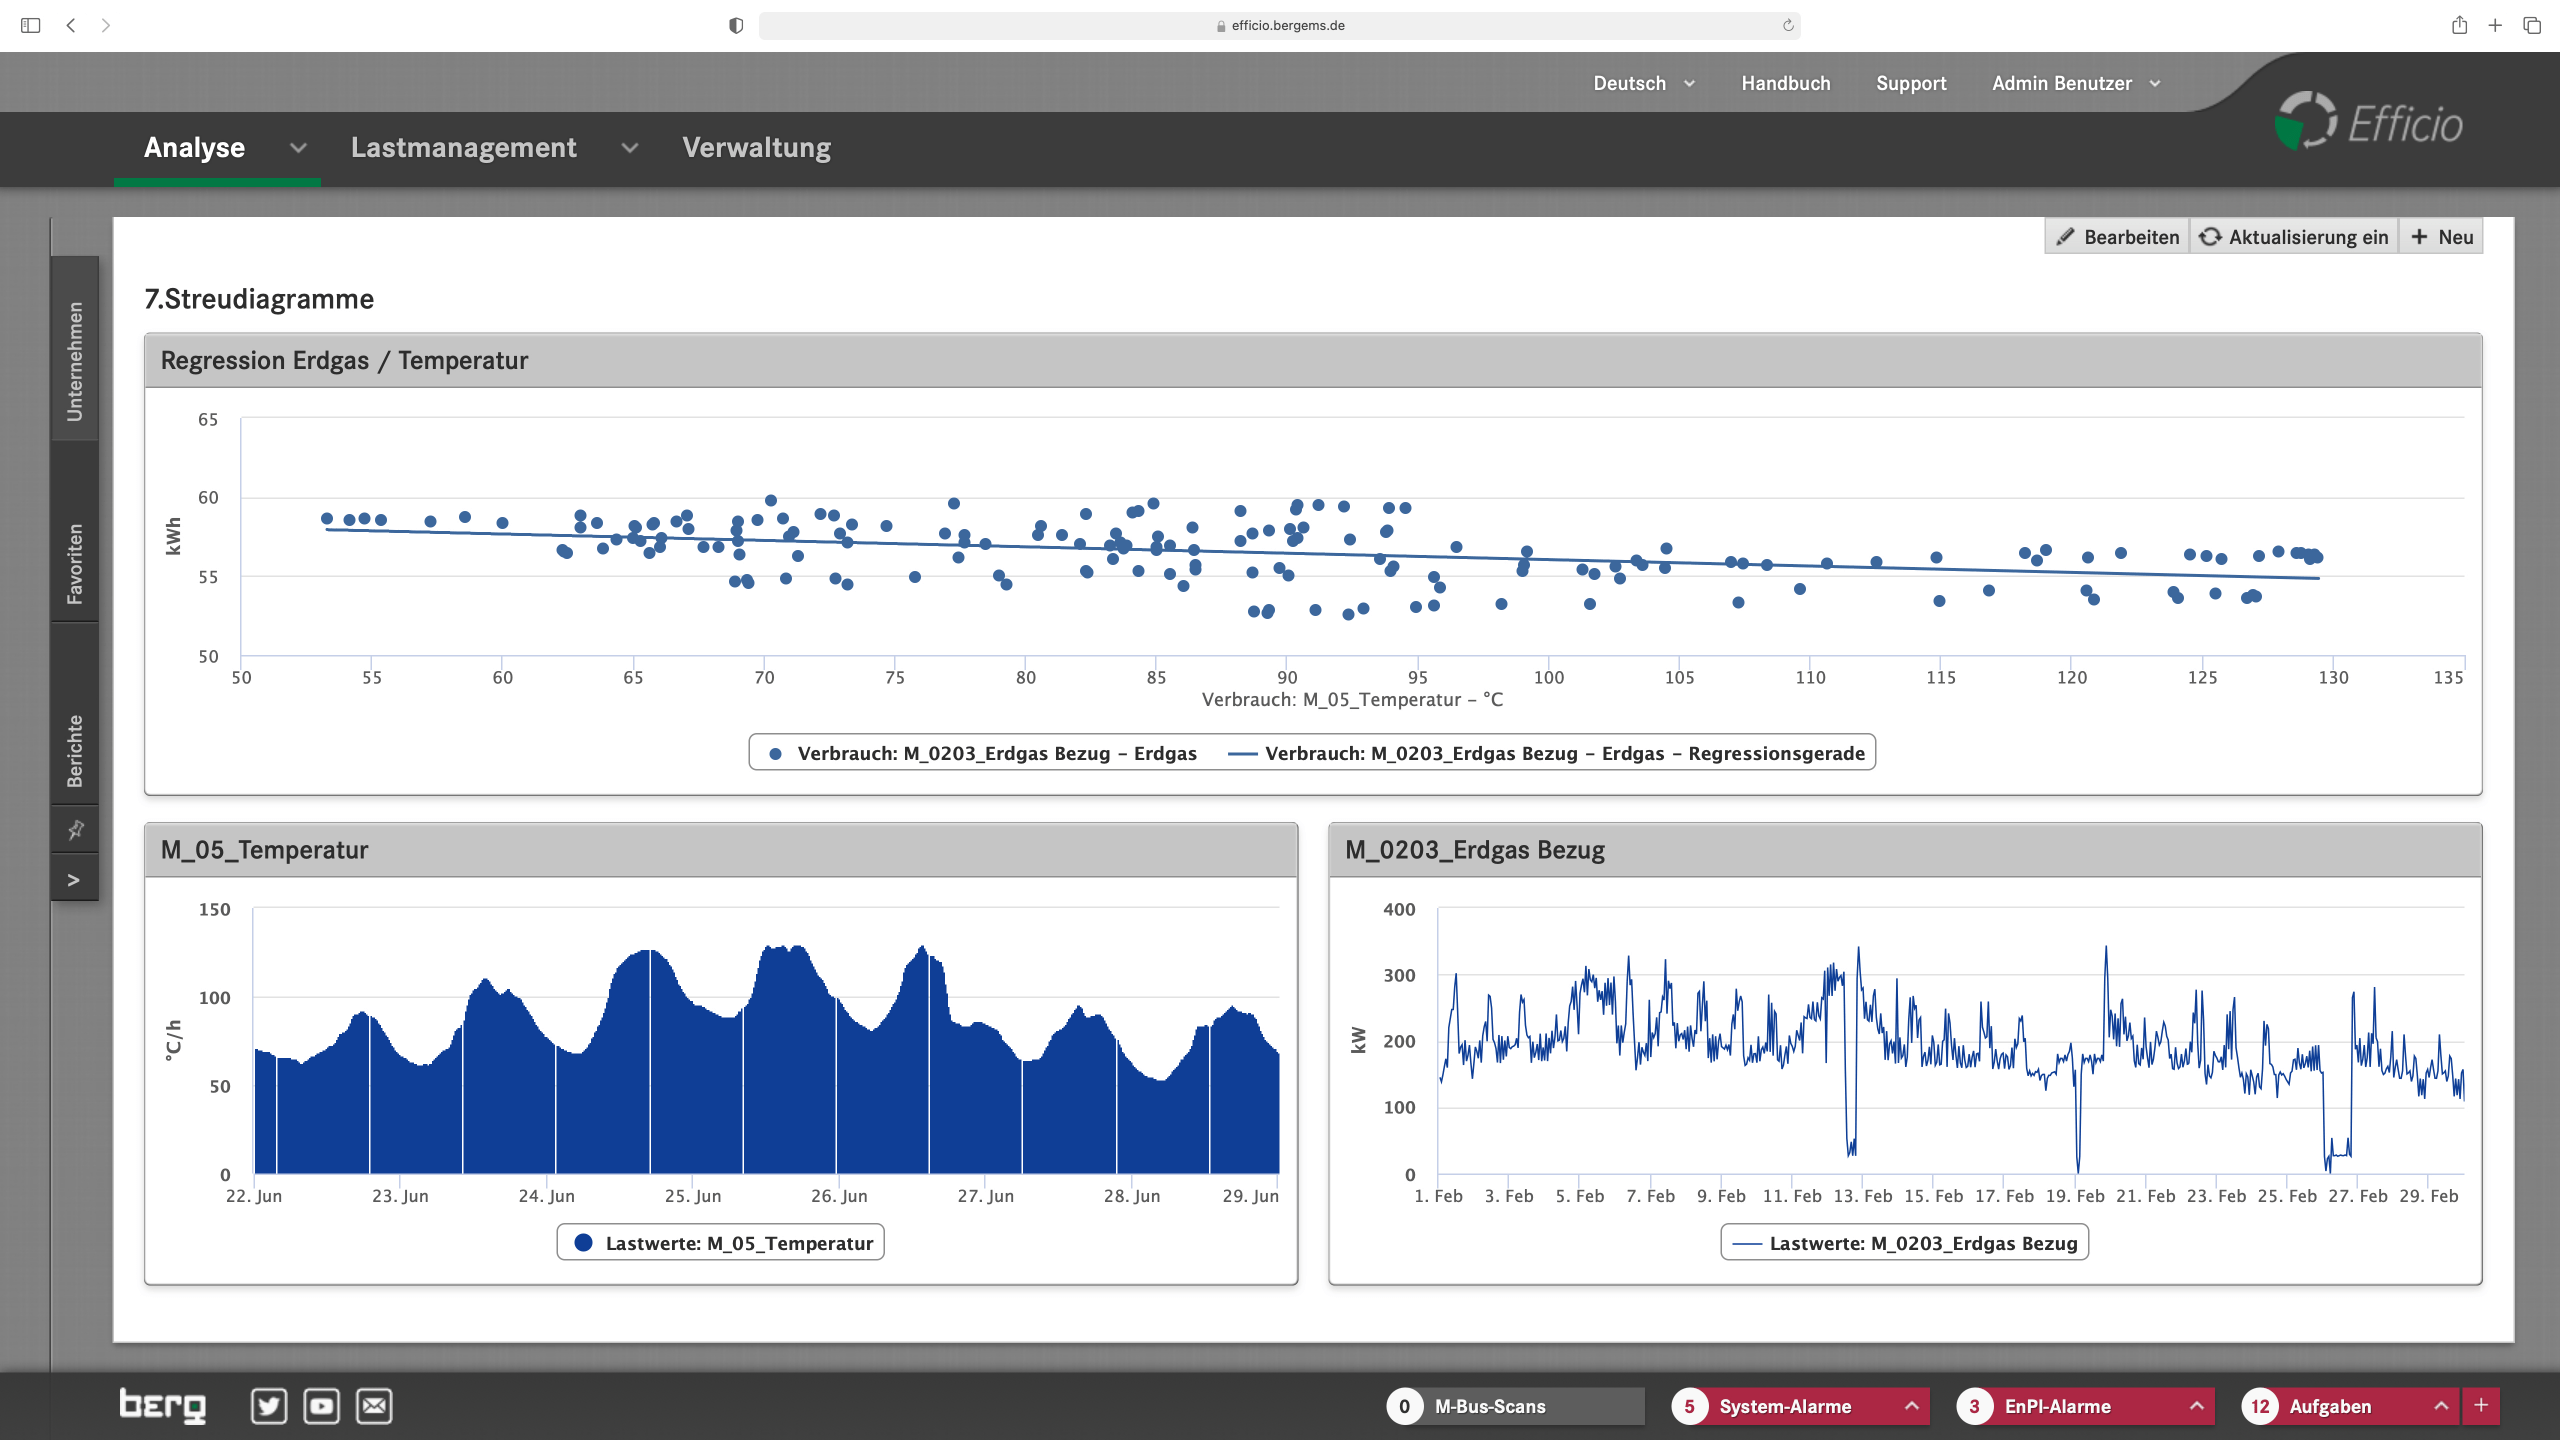
Scatter plots with regression analysis
- Immediately recognize conspicuous connections visually
- Represent the coefficient of determination R² according to ISO 50006
- Analyze dependencies between the measuring points with the display of xy plots
- Incorporate regression analyzes into reporting
Efficio mobile app
![]()
![]()
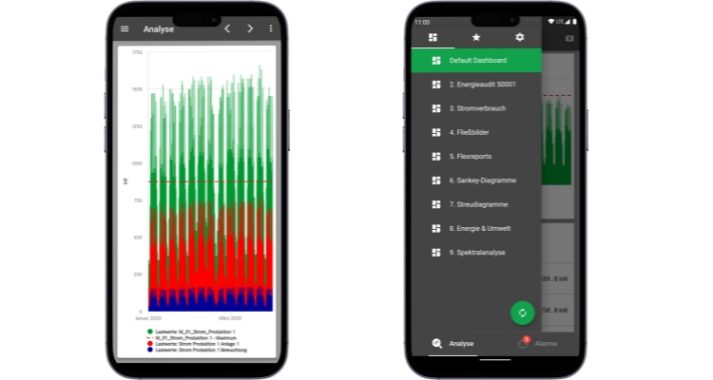
- All dashboards and favorites available on mobile devices
- After synchronization, it can also be used without a connection to the Efficio server
- Full-screen view possible in vertical mode to ensure optimal display even on smaller displays
- Dashboard widgets can be displayed on the smartphone in the original arrangement or as a list
- View and acknowledge current alarms
- App is available for Android and iOS smartphones or tablets
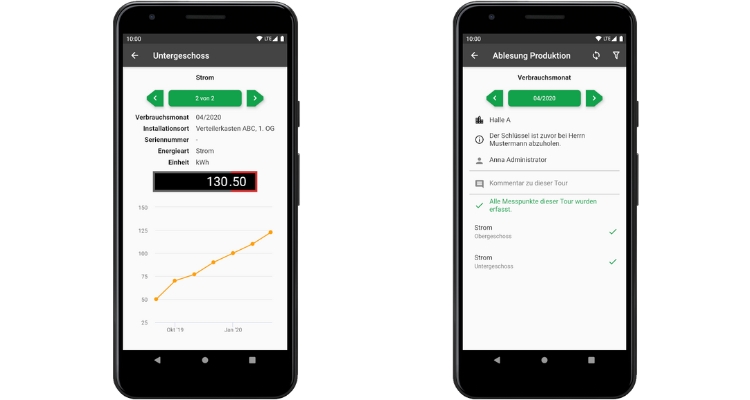
Efficio Tour app
-
- Support manual reading of meters in a tour using a mobile device (smartphone/tablet).
- Graphically visualize the last 7 readings to quickly identify incorrect readings or unknown meter changes
- In order to be able to represent a whole month with a daily reading, the last 30 days are kept
- Fast and automatic synchronization via WiFi
- Quickly recognize the completeness of the tour, change the order as desired despite the tour specifications, add readings
- Very clear number display and input keyboards
- No error-prone note-taking of readings with paper and pen
- Meter readings can also be done offline (without cell phone reception).
- App is available for Android and iOS smartphones or tablets
YOUR CONTACT PERSONS
Please contact us Contact our energy experts directly for more information and to make an appointment.

Max Heigl
Regional Sales Manager South/East & Austria
Torsten Fritsch
Regional Sales Manager North/East
Bernd Stäb
Regional Sales Manager South/West & Switzerland
Michael Alles
Regional Sales Manager Central
Dieter Kramm
Regional Sales Manager North/West